

Philadelphia spent over a decade writing plans, launching programs, naming task forces, and securing hundreds of millions of dollars in grants to make its streets safer. The city adopted Vision Zero in 2016, the international framework aiming to eliminate all traffic deaths by 2030. It signed executive orders, held community roundtables, published dashboards, and drew up High Injury Networks.
Philadelphia spent over a decade writing plans, launching programs, naming task forces, and securing hundreds of millions of dollars in grants to make its streets safer. The city adopted Vision Zero in 2016, the international framework aiming to eliminate all traffic deaths by 2030. It signed executive orders, held community roundtables, published dashboards, and drew up High Injury Networks.
In 2024, 125 people were killed in vehicle crashes in the city. Traffic fatalities that year continued to surpass pre-2020 levels, according to the city’s own Vision Zero Action Plan 2030. The year before, the number was 123.
Measured against what the city promised and what it spent, the math is difficult to ignore.
What the Rankings Actually Say
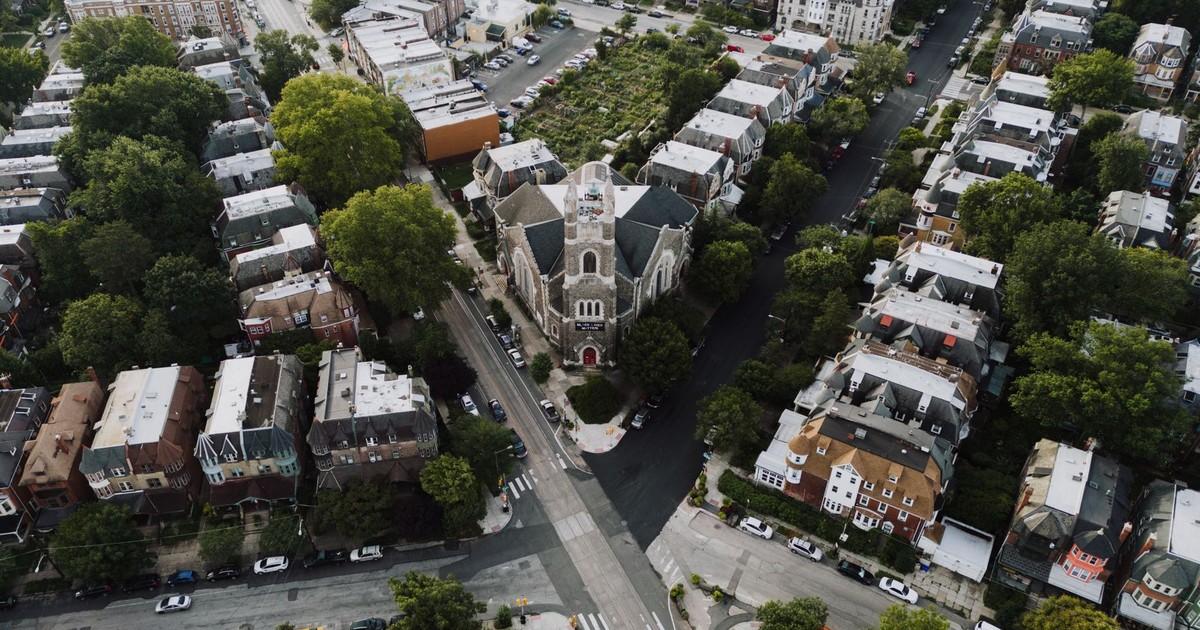
Both Philadelphia and Wilmington score as some of the least safe cities in the country, according to a 2024 report. The report looked at 182 cities across the country and ranked Philadelphia at 174th. The analysis assessed 41 key safety indicators, including the murder rate, the number of hate crimes, assaults, and deadly traffic crashes. Philadelphia had some of the highest numbers of murder and non-negligent manslaughter, as well as comparatively high numbers of drug overdose deaths and hate crimes.
That ranking wasn’t a one-off snapshot. U.S. News and World Report, drawing on recent FBI crime data, also placed Philadelphia at number 17 on its list of the 25 Most Dangerous Places in the U.S. for 2025. That assessment measured murders and property crimes per 100,000 residents, a narrower lens than the 41-indicator safety index, but one that tells a similar story. The broad picture and the crime-specific picture both land in the same place: Philadelphia near the bottom of the national list.
Overall safety scores are getting lower everywhere, one factor affecting every American metropolis. That doesn’t make Philadelphia’s position more comfortable. The whole country is declining, and Philadelphia is declining near the bottom of the list.
The Traffic Picture: Progress That Isn’t Enough
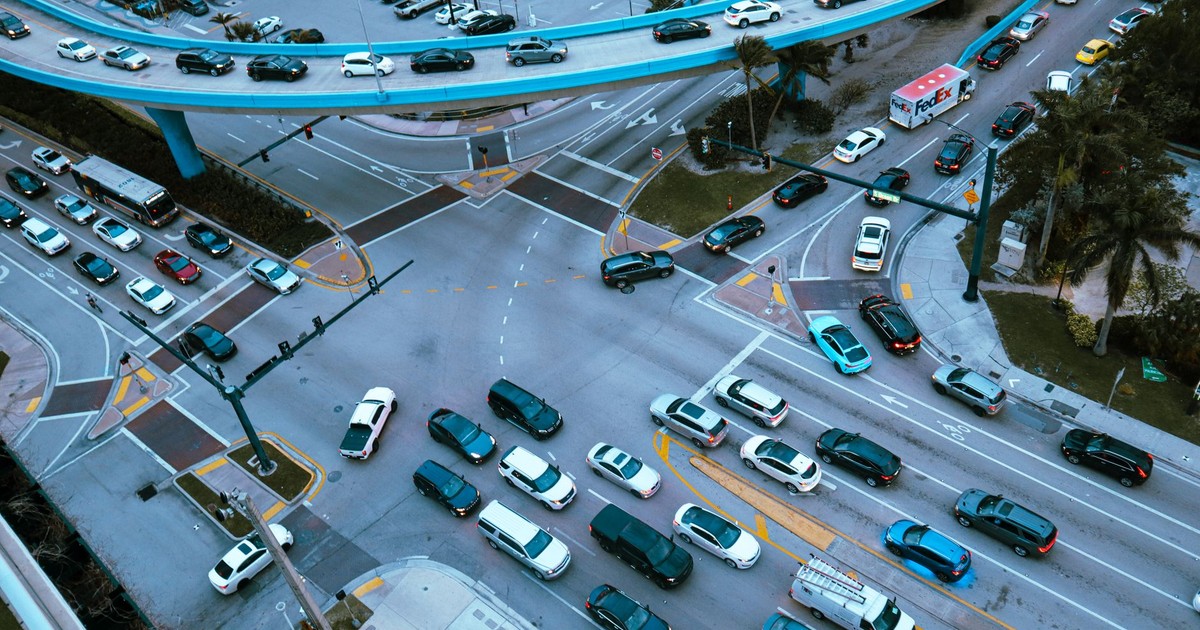
Philadelphia spends millions of dollars annually on traffic safety efforts like speed bumps and bike lanes, road-narrowing projects, red-light and speed cameras, and educational programs for schoolchildren. Yet year after year, more than 125 people die in traffic accidents, a rate much higher than in most big U.S. cities.
In Philadelphia, 80 percent of traffic deaths and serious injuries occur on just 12 percent of streets. These streets, called the “High Injury Network,” are being targeted by Vision Zero for strategic investments to reduce accidents, injuries, and deaths. The city knows exactly which streets are killing people and has known for years.
In 2024, less than 10 percent of all crashes involved people walking, biking, or riding a motorcycle. However, people traveling in those modes accounted for nearly two-thirds of the fatalities that year. The Philadelphia Department of Public Health found that Black and Hispanic Philadelphians experience higher rates of traffic-related deaths. The streets that are most dangerous are also, reliably, the streets in the neighborhoods with the least political leverage.
Philadelphia has won at least $71 million in federal infrastructure grants over the past three years for Vision Zero projects in various stages of design or construction. Mayor Jim Kenney launched Vision Zero in 2016 with a goal of eliminating traffic deaths by 2030. Ten years on, the city is not close. Philadelphia still has one of the highest traffic death rates among big cities in the U.S., and traffic fatalities were near pre-pandemic levels heading into 2026.
There have been wins worth naming. Since speed cameras were installed on Roosevelt Boulevard in 2020, speeding violations have decreased by over 95 percent, fatal and serious injury crashes have decreased 21 percent, and crashes involving pedestrians have decreased 50 percent. In areas with Complete Streets projects, there have been 34 percent fewer fatal and serious injury crashes and 20 percent fewer total crashes causing injury. Those are real numbers attached to real interventions. The problem is scale: the interventions cover a fraction of the streets that need them.
The Funding Fight

Mayor Cherelle Parker’s spending cuts to the Vision Zero traffic-safety program remained in the budget passed by City Council in 2024, despite a push to restore them from advocates for pedestrians and cyclists, neighborhood groups, and several Council members. The Parker administration will spend $1 million for Vision Zero projects, down from $2.5 million under Mayor Jim Kenney.
In her first budget, the Vision Zero line was cut from $2.5 million to $1 million, and the city projected spending $9 million on the program over six years, compared to $15 million during the Kenney administration. City officials defended the decision by pointing to other budget lines: speed camera funding, the Streets Department’s traffic-calming budget. Advocates were not satisfied by that accounting.
Last year, 37 registered community organizations submitted detailed proposals for slow zones based on safety priorities identified by residents, but only two projects were funded. City Councilmembers heading into annual budget negotiations have been considering advocates’ calls for a major funding hike of $5 million for the Vision Zero traffic safety program.
According to the Bicycle Coalition of Greater Philadelphia, the first six months of 2025 saw the lowest traffic fatality count since before 2019, with 39 people killed in crashes in that period. In the spring of 2025, City Council voted unanimously to implement automated speed cameras in school zones citywide. The Automated Speed Enforcement camera program, which has resulted in a 95 percent drop in speeding violations and a nearly 50 percent drop in pedestrian-involved crashes since it first launched on Roosevelt Boulevard in 2020, expanded to the entirety of Broad Street and a short section of Old York Road. These are genuine steps. They are also, measured against the scope of the High Injury Network, incremental.
The Homicide Trend: Real Progress, Real Caveats
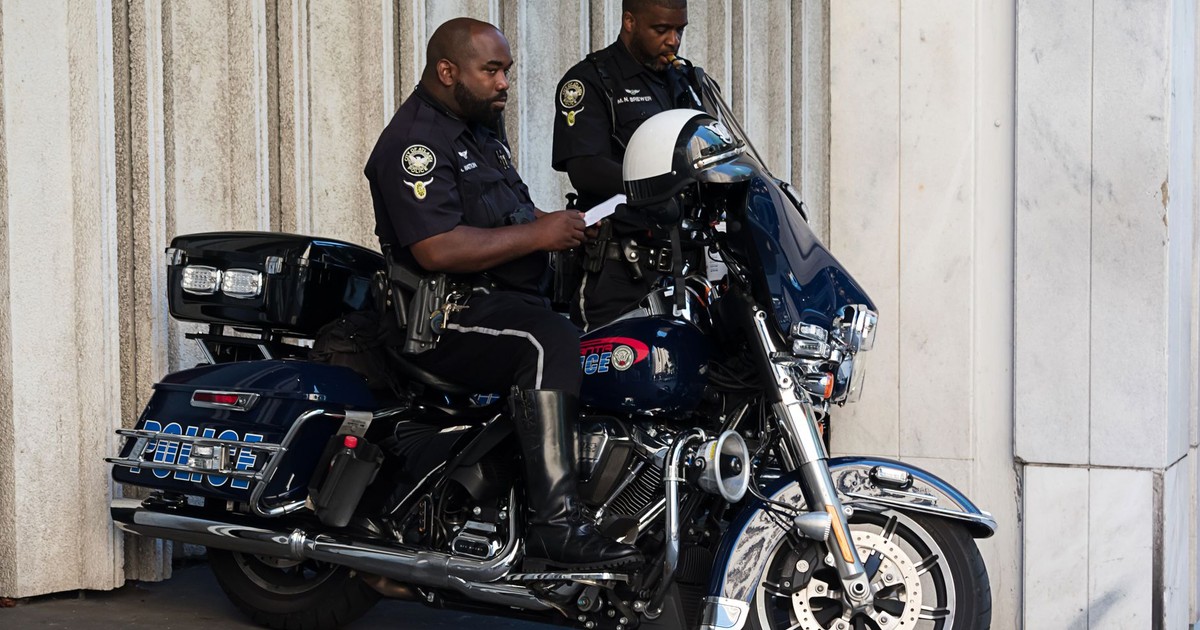
Gun violence in Philadelphia follows its own arc, separate from the traffic story but equally defining for how the city ranks on safety indices. The pandemic-era homicide spike in 2021 resulted in the single worst year of homicides recorded in the city’s history, with 562 lives lost. Philadelphia homicides fell approximately 34 percent from 2023 to 2024, part of a national trend in which the FBI recorded a nearly 15 percent decline in murders nationwide that year. The 2024 total was both 52 percent lower than the 2021 peak and 28 percent below 2019 levels.
Based on year-end data from the Philadelphia Police Department, there were 222 homicides recorded in Philadelphia in 2025. That is 17 percent lower than in 2024 and the lowest total recorded since 1966. Gun robberies are down 22 percent, aggravated assaults with a gun fell 14 percent, and shooting incidents decreased 29 percent from the prior year, to 826 shootings.
What the numbers don’t fully convey is the weight of what came before. Despite all the progress, many Philadelphians are still living through the pain of the 3,839 gun deaths and 16,475 shootings that marked the city between 2015 and 2024. A city does not shake that off because a single year’s count improved. And despite the drop in many statistics, more than 1,000 people were injured by gunfire in Philadelphia in the last 12 months.
The drop in homicides also hasn’t translated neatly into a better national ranking. When safety assessments were compiled in 2024 and 2025, Philadelphia still sat near the bottom. Rankings of this kind incorporate data with a lag, and they account for conditions that don’t improve just because homicide statistics do: drug overdose deaths, hate crimes, financial insecurity. The city’s ranking problem is structural, not just statistical.
Why Philadelphia’s Streets Remain So Deadly
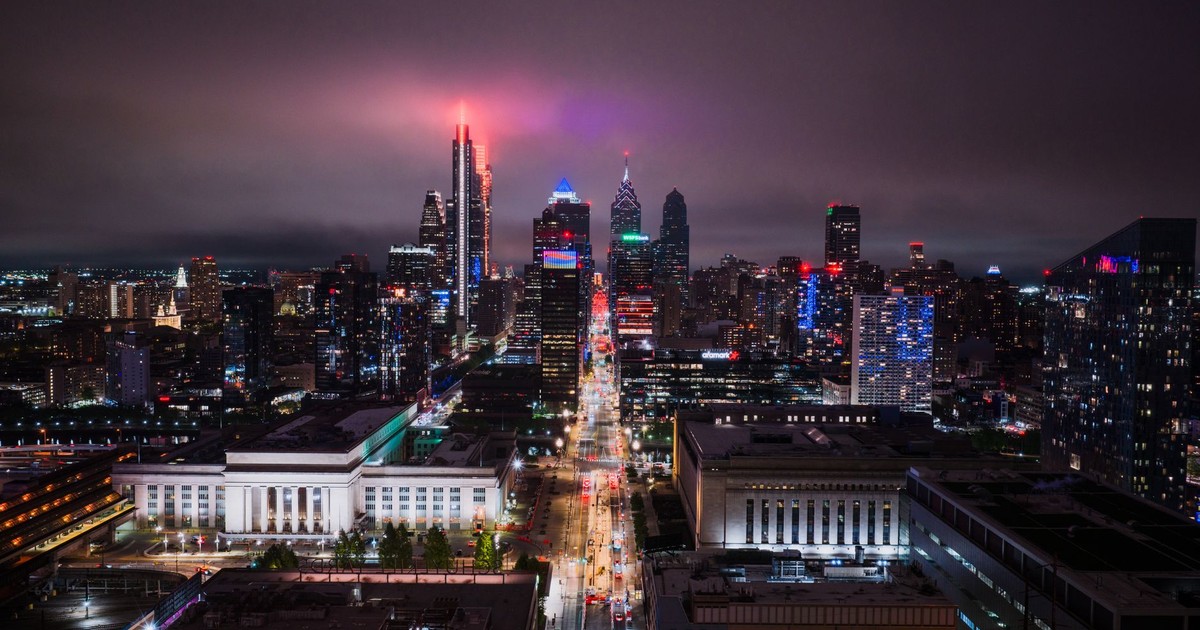
The pattern on Philadelphia’s roads is not a mystery. In 2020, at the onset of the COVID-19 pandemic, Philadelphia saw a dramatic increase in the number of fatal crashes and has yet to return to pre-2020 levels. Traffic violence is felt unequally by underserved communities in Philadelphia, with fatal or serious injury crashes three times more likely to occur in areas of concentrated disadvantage.
Part of the problem is structural. Philadelphia’s street grid was largely designed in the colonial era and retrofitted for 20th-century car traffic in ways that consistently prioritized vehicle throughput over pedestrian survival. Broad Street, one of the city’s main arterial corridors, recorded 14 traffic fatalities in the first nine months of 2024 alone. While New York City has successfully implemented extensive traffic-calming measures and protected bike lanes, Philadelphia’s efforts to retrofit its colonial-era street grid for modern traffic have yielded mixed results. Despite securing over $200 million in safety improvement grants since 2016, Philadelphia’s traffic safety initiatives have struggled to match the success of other major cities.
Part of it is political. Speed limit changes on state-designated roads require Pennsylvania’s legislature to act; the city cannot simply lower limits on its own. Pennsylvania’s legislature would need to amend the state’s vehicle code to grant Philadelphia the authority to set its own speed limits on key corridors. That kind of state-level permission has not come quickly.
Part of it is pace. A sharp critic at a City Council hearing put it plainly: “Vision Zero safety interventions work in the places they are installed, but if we are only doing 5 miles of bike lanes or five segments of the High Injury Network per year, we aren’t going to reach the City’s Vision Zero by 2050 goal for a century.” That math doesn’t require a policy degree to follow.
What to Make of This
Philadelphia is genuinely getting safer on some of the metrics that matter most. The homicide decline is real and sustained, not a single year’s anomaly. Traffic deaths fell meaningfully in the first half of 2025. Speed cameras are working where they have been installed. The city’s Vision Zero Action Plan is a detailed, community-informed document that names specific targets, specific corridors, and specific accountability measures.
But the national rankings don’t move fast, and for good reason. They incorporate data with a lag and account for conditions that don’t shift just because homicide statistics improve in a given year: drug overdose deaths, hate crimes, financial insecurity. In cities across the country, homicide rates have dropped below pre-pandemic levels. In Philadelphia, the 2024 total had the fourth-lowest number of homicides in 55 years, and 2025 came in lower still. That is progress by any measure. It is also still 222 people dead in a single year in a single city.
On Philadelphia street safety, in traffic deaths, in pedestrian fatalities, in the concentration of risk on a known set of corridors that the city has documented for a decade, a wide distance remains between what was promised and what has been delivered. That distance keeps Philadelphia near the bottom of the national list. Some of it is money. Some of it is state politics. Some of it is the sheer difficulty of reengineering a major city’s infrastructure while also managing a budget crisis, a police staffing shortage, and the long aftermath of a pandemic that bent every metric in the wrong direction at once. None of that is an excuse, but it is the actual problem the city is dealing with. The question Philadelphia residents are most entitled to ask isn’t whether things are better than 2021. It’s whether the pace of improvement matches the scale of what was promised. So far, the answer is no.
Disclaimer: This information is not intended to be a substitute for professional medical advice, diagnosis, or treatment and is for information only. Always seek the advice of your physician or another qualified health provider with any questions about your medical condition and/or current medication. Do not disregard professional medical advice or delay seeking advice or treatment because of something you have read here.
AI Disclaimer: This article was created with the assistance of AI tools and reviewed by a human editor.